YouTube outlier research: find the videos that beat their own channel's baseline.
By the Vwrap team · Updated September 8, 2026
A YouTube outlier is a video that beat its own channel's normal performance. Vwrap divides the video's views by that channel's trimmed-median baseline for the same format and the same age bucket, so a 24.2× card means 24.2 times what that channel usually does with a video of that age, not 24.2 times some platform average. Search a niche, filter by channel size, format, window and minimum multiplier, then open a card and read the baseline the number came from.
How to run an outlier search
Search a niche, or a single channel
Research opens with a Keyword / Channel toggle. Keyword searches the indexed corpus and reads the query back above the results: "Showing results for “piano” · 15 videos". Channel mode takes a channel name, @handle or URL when you want one creator's outliers instead of a niche's.
Narrow with the filter bar
Five subscriber-tier pills (Under 10K, 10K–50K, 50K–100K, 100K–500K, 500K+), a Long-form / Shorts switch, a Range from the last 7 days to the last year, and a Min multiplier of 1×, 2×, 5×, 10× or 25×. The format switch matters most: it decides which set of baselines every multiplier on screen was measured against.
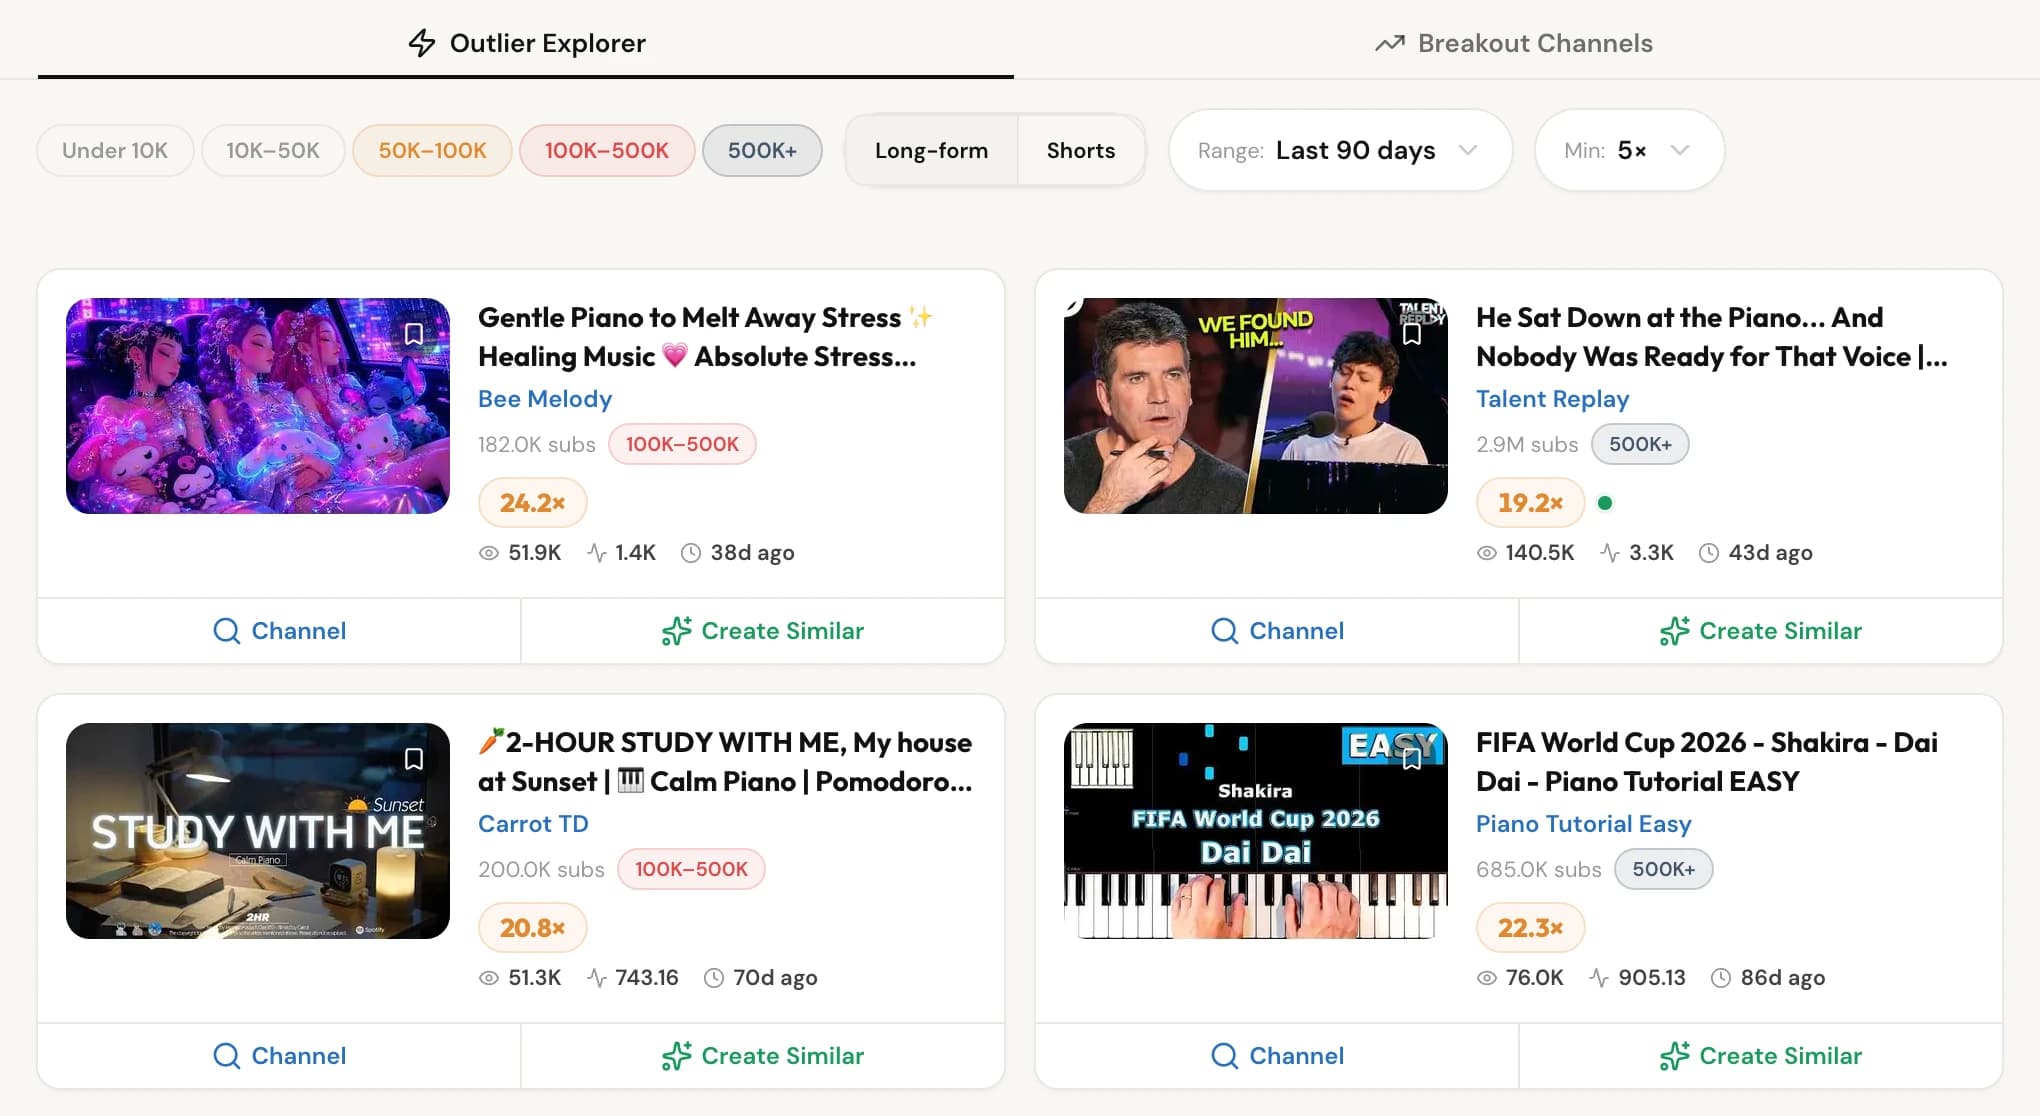
Four results for "piano", filtered to channels above 50K subscribers, the last 90 days, and a minimum of 5×. Each card carries the multiplier, total views, and how long ago the video went up. Open a card and check the arithmetic
Clicking a card opens the Why This Worked drawer: the multiplier and what it was measured against ("vs. channel's 31–90d median"), engagement rate as plain likes plus comments over views, total views, the confidence label with the sample range behind it, and the age bucket the baseline was drawn from.
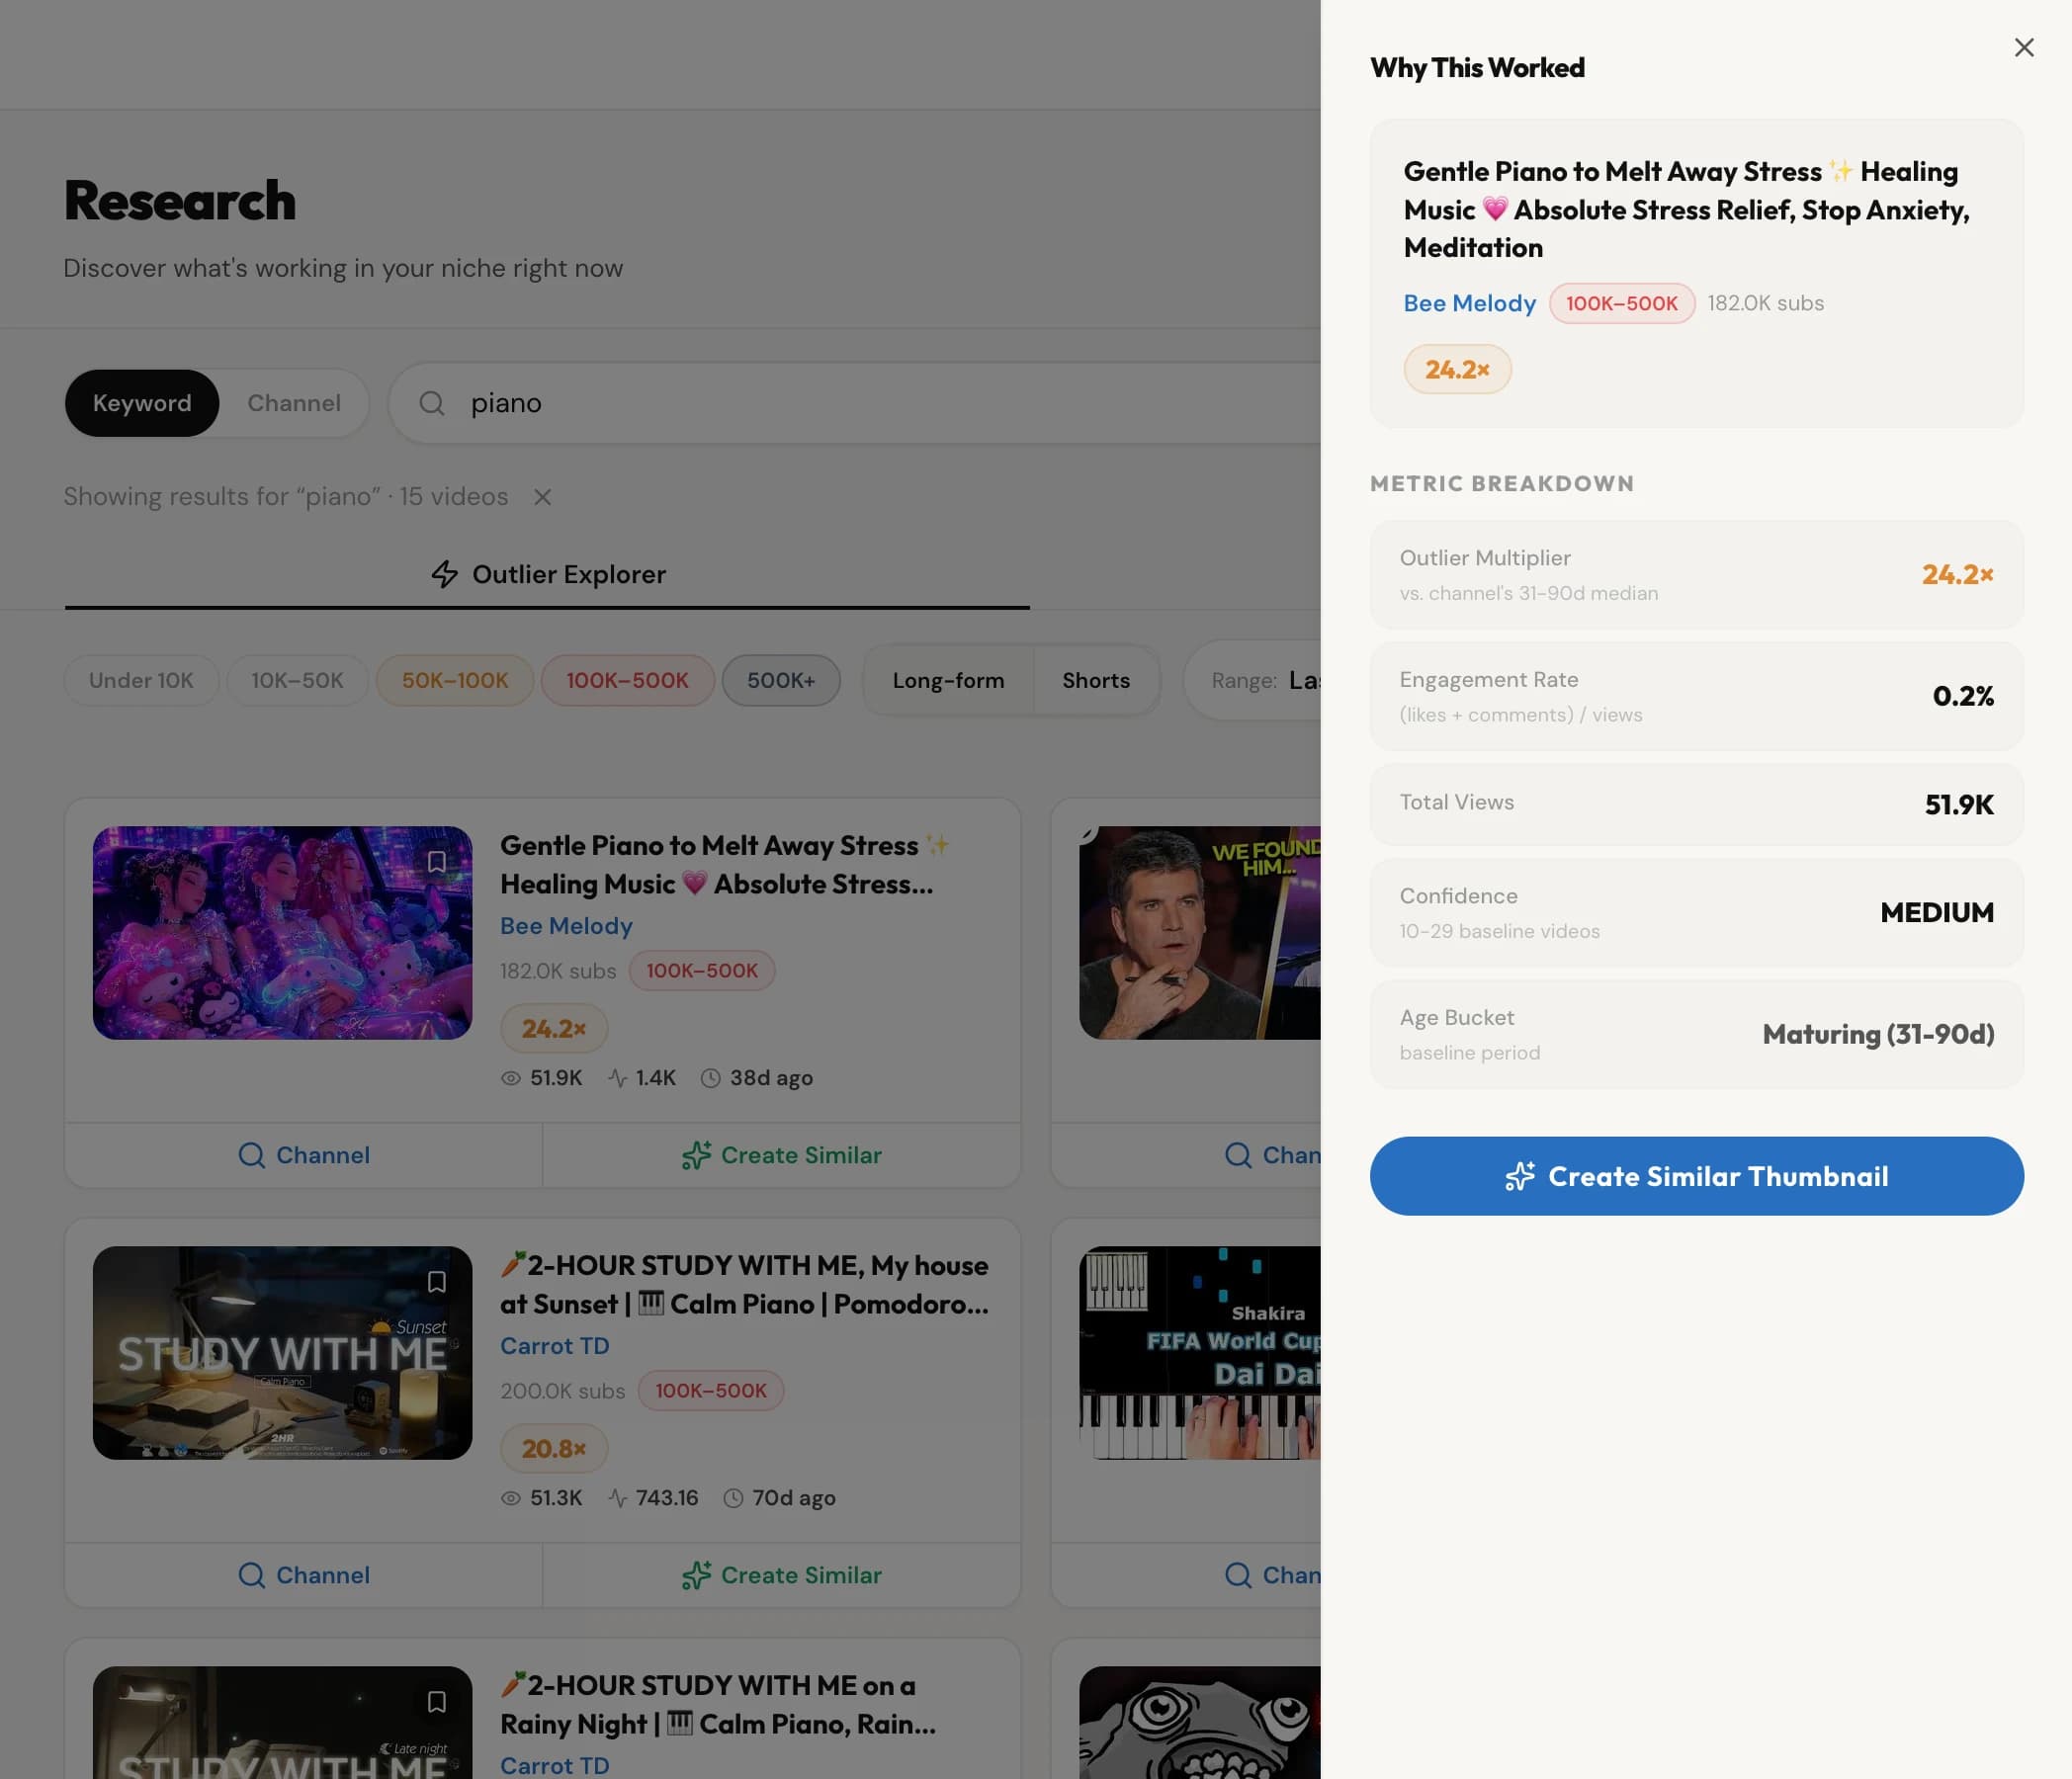
A 24.2× card opened up: measured against the channel's 31–90d median, MEDIUM confidence on a 10–29 video baseline, 51.9K total views. Send one through to the generator
Create Similar opens the create page with that thumbnail already attached as a reference image, and sends the source video's title along with the job, so the pattern you just found is the starting point instead of a note you retype. Channel opens that creator's profile page, where their videos are listed by outlier multiplier.
How the multiplier is calculated
Every card's number is one division: the video's views over its channel's baseline for the same format and the same age bucket. The baseline is a trimmed median. Take that channel's qualifying videos in the group, drop the top and bottom 10% once there are at least ten of them, then take the median of what's left. Trimming is what stops a single viral upload, or a single sacrificial flop, from moving the bar the rest of the channel is measured against.
Long-form and Shorts hold separate baselines and are never pooled. The seven age buckets are 0–3d, 4–7d, 8–14d, 15–30d, 31–90d, 91–365d and 365d+; when a bucket holds fewer than five qualifying videos it merges with its neighbours (fresh, maturing or established) before the median is taken. The colour band follows the result: 1–2× normal, 2–5× notable, 5–10× strong, 10–25× exceptional, 25× and up extreme.
What the confidence label means
Confidence counts the videos behind the baseline, after any bucket merge: under 10 is LOW, 10 to 29 is MEDIUM, 30 or more is HIGH. It describes the denominator, not the video. A 40× computed against six comparable uploads is a thinner claim than a 6× computed against forty, and the drawer tells you which one you are reading.
LOW results are dimmed rather than hidden, because a young channel with a short history still tells you something. You just shouldn't build a quarter of content on one card. The thresholds were raised from 5 and 15 in April 2026, after a bootstrap on our own corpus put baseline relative error near 16% at fifteen videos and near 11% at thirty. Thirty is where the number stops moving much, so that is where we start calling it high.
How results are ranked
Three lists are merged, not one. A semantic list ranks videos by cosine similarity between your query and stored video embeddings; a full-text list ranks exact word matches through Postgres full-text search; an outlier list ranks by multiplier with a recency decay of exp(−days ÷ 60) applied to the sort. Reciprocal rank fusion combines them, weighted 0.50 outlier, 0.30 semantic, 0.20 full-text, so relevance alone cannot out-rank over-performance.
The decay never touches the stored multiplier. A two-year-old 30× still reads 30×; it just sorts below a fresh one. The precomputed rankings table keeps only videos at 1.5× and above, but the semantic and full-text lists are not restricted to that table and the Min filter starts at 1×, so lower-multiplier videos do appear in results. Raise Min when you only want the strong ones.
Access and plan specs
| Pro trial on signup: full Pro access, no card required | 7 days |
| Trial credits granted at signup; unused ones expire when the trial ends | 500 credits |
| Free plan monthly grant, first issued when the trial ends | 125 credits |
| Free plan after the trial: results returned per search, gated server-side | 4 results |
| Starter monthly credits, which pay for generation and edits, never for searching | 2,500 credits |
| Pro monthly credits, which also unlock the premium image models | 5,500 credits |
| Studio, monthly credits | 15,000 credits |
What outlier research does not do
- Long-form and Shorts baselines are never mixed, and there is no combined view. The Long-form / Shorts switch decides which set of baselines you are reading.
- After the 7-day Pro trial, a free account gets 2 searches per day, reset at midnight UTC, and the top 4 results of each. The rest render as locked placeholders. The withheld results never leave the backend, so there is nothing to peek at in the response.
- A multiplier is relative to one channel, never to the niche. 24× on a channel that normally does 2K views is a smaller video than 3× on a channel that normally does 2M. Read it next to total views.
- LOW confidence means fewer than 10 comparable videos stood behind the baseline. The multiplier is still shown, dimmed: a real number over a thin denominator.
- Baselines and rankings are recomputed in batches rather than on request, so a video published in the last day or two may not have a settled multiplier yet.
- Everything here comes from YouTube's public Data API v3. Click-through rate, impressions and audience retention belong to the channel owner and are in no public API, so this tool cannot show them for someone else's video.